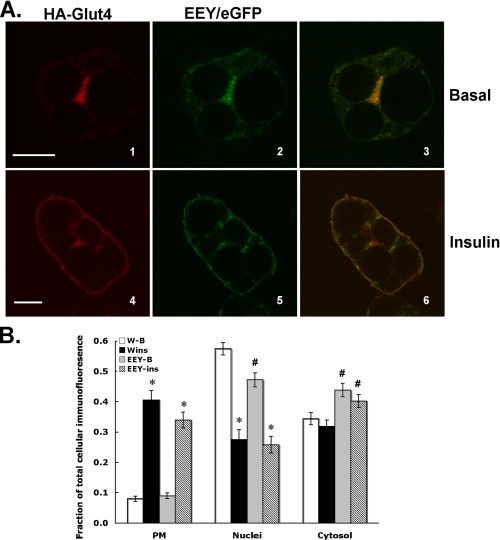
FIGURE 12.
Colocalization of HA-Glu499-Glu501-Tyr502/eGFP and HA-Glut4. 3T3L1 adipocytes were co-infected with recombinant adenoviruses encoding HA-Glut4 and Glu499-Glu501-Tyr502/eGFP. 48 h post-infection the cells were serum-starved for 2 h and then either maintained in the basal state or treated with insulin for 30 min. The cells were then processed for laser confocal immunofluorescence microscopy as described under “Experimental Procedures.” A, the localization of HA-Glu499-Glu501-Tyr502/eGFP is shown in green in the middle panels. The localization of HA-Glut4 is shown in red in the left panels. Merged images are shown in the right panels with colocalization between the two different proteins indicated in yellow. Scale bars represent 10 μm. B, quantification of the fluorescence intensity in different regions of the cell as a fraction of total cellular fluorescence intensity. The data represent the mean ± S.E. of 5-7 independent experiments. See the legend to Fig. 5 for details concerning the quantification procedure and the definition of the subcellular regions. *, p < 0.01 relative to the corresponding basal fraction; #, p < 0.01 relative to the corresponding fraction from HA-Glut4.

