FIGURE 7.
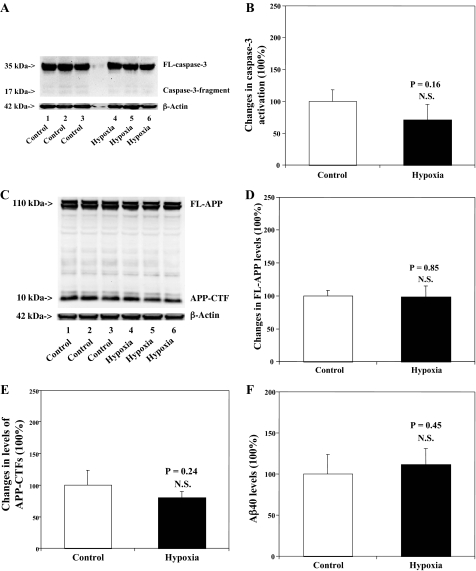
Hypoxia (18%) does not affect caspase-3 activation, APP processing, nor Aβ generation in H4-APP cells. A, hypoxia treatment alone (lanes 4–6) does not induce caspase-3 cleavage (activation) as compared with control conditions (lanes 1–3) in H4-APP cells. There is no significant difference in amounts of β-actin in control conditions or hypoxia-treated H4-APP cells. B, quantification of the Western blot shows that hypoxia treatment (black bar) does not increase caspase-3 activation compared with control conditions (white bar)(p = 0.16, NS), normalized to β-actin levels. C, hypoxia (lanes 4–6) does not affect APP processing as compared with control conditions (lanes 1–3) in H4-APP cells. There is no significant difference in amounts of β-actin in control conditions or hypoxia-treated H4-APP cells. D, quantification of the Western blot shows that hypoxia treatment (black bar) does not alter levels of FL-APP as compared with control conditions (white bar) (p = 0.85, NS), normalized to β-actin levels. E, quantification of the Western blot shows that hypoxia treatment (black bar) does not alter levels of APP-CTFs as compared with control conditions (white bar)(p = 0.24, NS), normalized to β-actin levels. F, hypoxia (black bar) does not increase generation of Aβ40 as compared with control conditions (white bar)(p = 0.45, NS).

