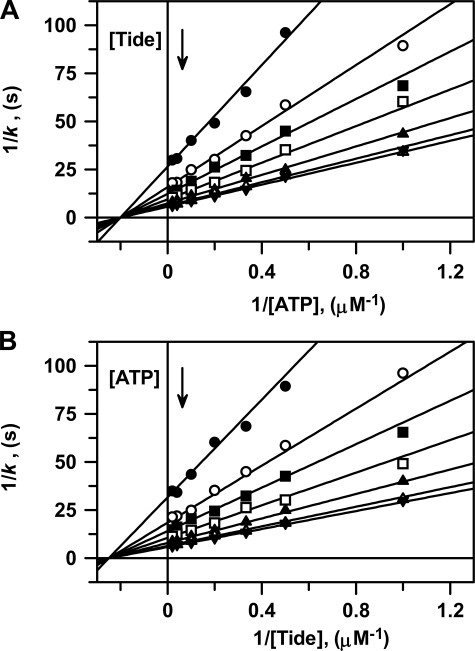
FIGURE 1.
Two-substrate steady-state kinetics. Double reciprocal plots of A, 1/k versus 1/[ATP] and B, 1/k versus [Tide] performed at 25 °C. In both reciprocal plots, the concentration of one substrate was varied at seven different concentrations of the fixed substrate (1 μm (•), 2 μm (○), 3 μm (▪), 5 μm (□), 10 μm (▴), 25 μm (▵), and 50 μm (▾)). The solid lines were generated using the kinetic constants determined from the global fit of the data to Equation S8, and the reciprocal forms of this equation were generated with either ATP (Equation S13) or Tide (Equation S17) as the varied substrate.

