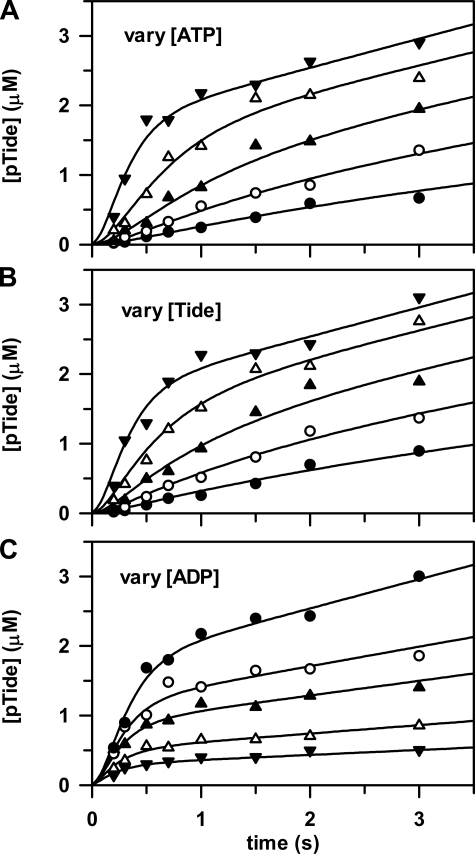
FIGURE 3.
Pre-steady state kinetics. The rapid-quench-flow apparatus was used to measure three companion sets of pre-steady state kinetic data, whereby free enzyme from one sample loop (2 μm, concentration after mixing) was reacted at 25 °C with the following final concentrations of reactants from the other sample loop: A, [Tide] = 200 μm and [ATP] = 5 μm (•), 10 μm (○), 20 μm (▴), 50 μm (▵), and 200 μm (▾); B, [ATP] = 200 μm and [Tide] = 5 μm (•), 10 μm (○), 20 μm (▴), 50 μm (▵), and 200 μm (▾); and C, [ATP] = [Tide] = 200μm and [ADP] = 0μm (•), 100μm (○), 200μm (▴), 500μm (▵), and 1000μm (▾). The curves are from global fitting of all time progress data to the Ordered Bi Bi mechanism in Scheme 1 with DynaFit (12), which yielded the rate constants given in Table 2.

