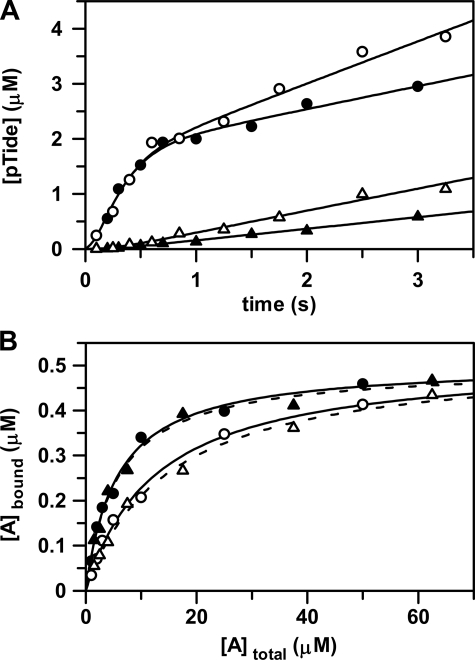
FIGURE 4.
Effects of osmolyte on ADP release and nucleotide binding. A, the rapid-quench-flow apparatus was used to measure: (i) pre-steady state kinetic experiments in the absence (•) and in the presence of 5% (w/v) PEG-8000 (○) and (ii) catalytic trapping experiments in the absence (▴) and in the presence of 5% (w/v) PEG-8000 (▵). For pre-steady state kinetic experiments, free enzyme from one sample loop was reacted at 25 °C with ATP and Tide from the other sample loop. The concentrations after mixing were [E] = 2 μm with [ATP] and [Tide] = 200 μm. For catalytic trapping experiments, enzyme preincubated with ADP from one sample loop was reacted at 25 °C with ATP and Tide from the other sample loop. The concentrations after mixing were [E] = 2 μm with [ADP], [ATP], and [Tide] = 200 μm. The curves for pre-steady state (•) and catalytic trapping (▴) in the absence of 5% (w/v) PEG-8000 were generated with the kinetic constants in Table 2. The curves for pre-steady state (○) and catalytic trapping (▵) in the presence of 5% (w/v) PEG-8000 were generated with the kinetic constants in Table 2, but with 2-fold increased values of k–1 and k+5. B, the radiometric filter-binding assay was used to measure equilibrium binding of enzyme (0.5 μm) at 25 °C (i) with varying concentrations of [8-14C]ATP (∼500 cpm/pmol, and 1, 2, 3, 5, 10, 25, and 50 μm) in the absence (•) and in the presence of 5% (w/v) PEG-8000 (○) and (ii) varying concentrations of [8-14C]ADP (∼500 cpm/pmol; and 1.5, 2.5, 4, 7.5, 17.5, 37.5, and 62.5 μm) in the absence (▴) and in the presence of 5% (w/v) PEG-8000 (▵). The curves were generated by direct fitting of the data to Equation 7. In each case, the limiting amount of bound nucleotide approximately equaled the amount of enzyme, indicating one nucleotide binding site (i.e. C ∼ [Etot] = 0.5 μm).

