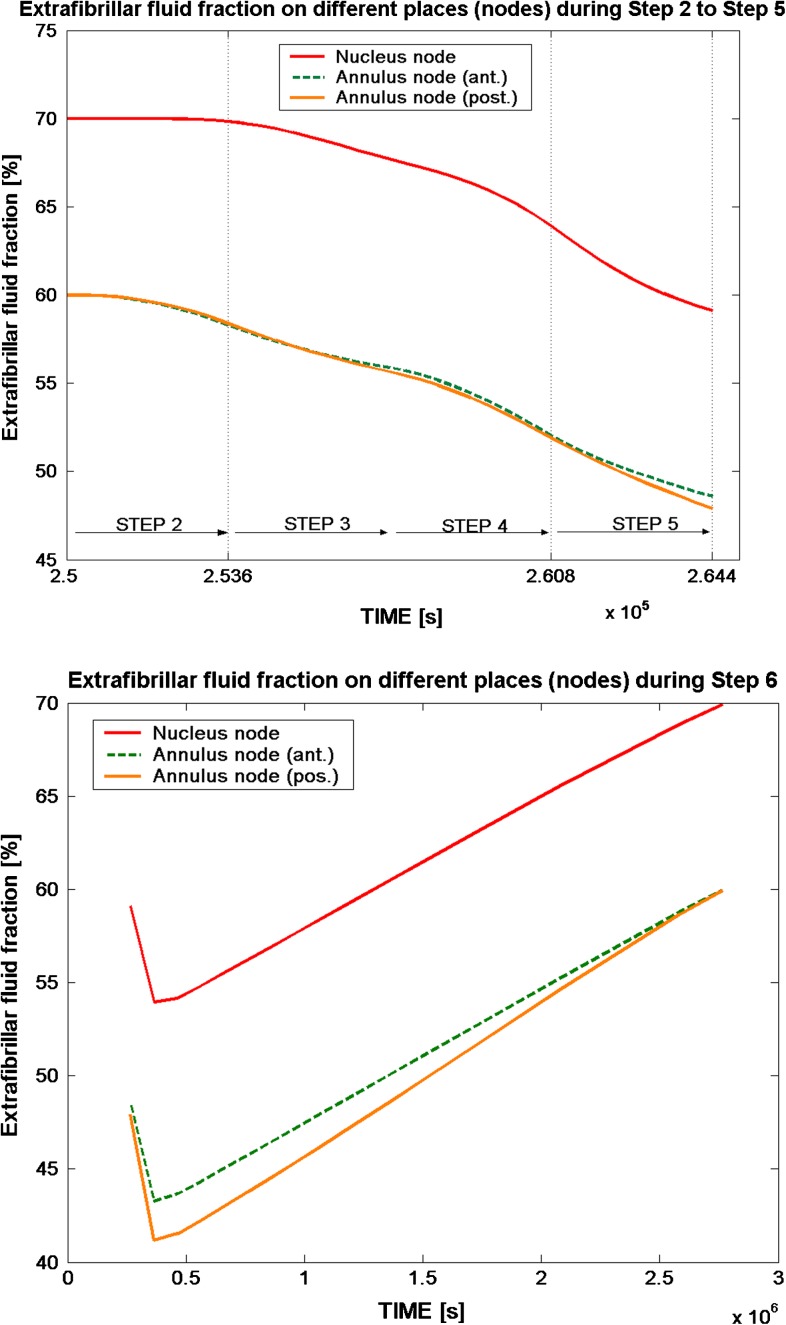
Fig. 3.
The extrafibrillar fluid fraction on different nodes (black dots in Fig. 2) from the anterior to the posterior side in the nucleus and annulus during step 2 (start loading) to step 6 (fully unloaded). The top figure shows the loading steps 2–5, with a time scale of 3,600 s for each step, while step 6 (bottom figure) simulates a resting period; in with the fluid is regained after load removal

