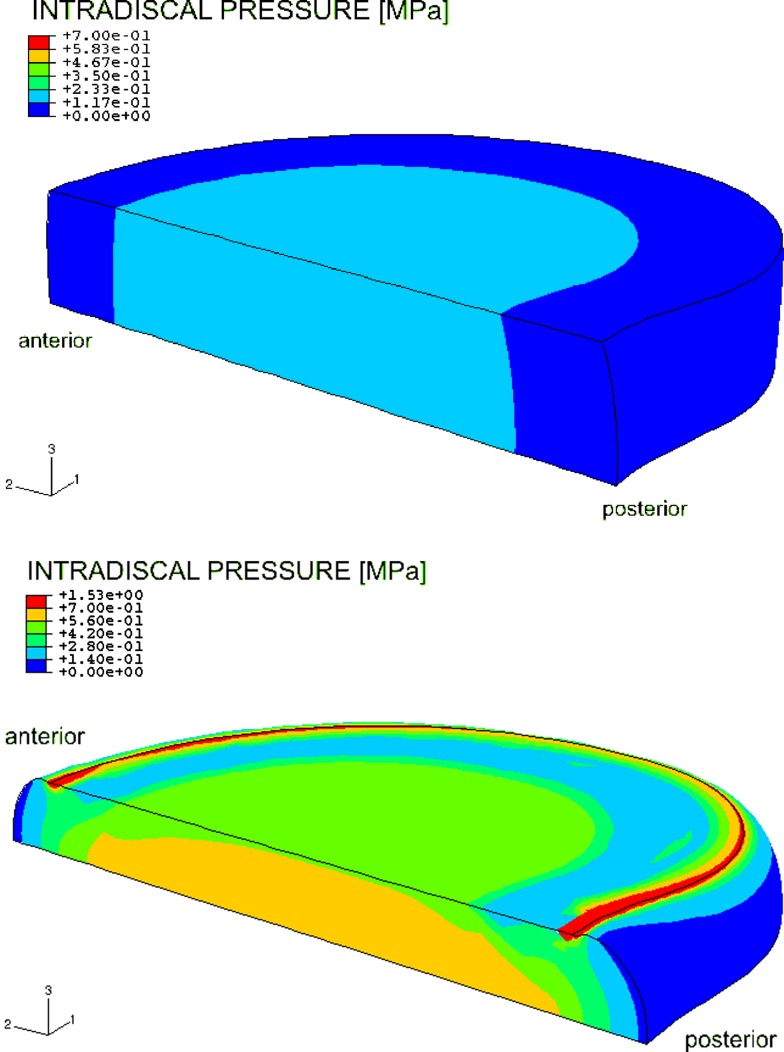
Fig. 4.
Color plot of unloaded model (top) and axially loaded model with 1,000 N (bottom) showing the intradiscal pressure. The highest noticeable pressure (ca. 0.7 MPa) starts from the transversal plane to the top plate on the medial sagittal plane with a concentration in the center of the nucleus. The pressure in the inner annulus neighboring the nucleus also increased

