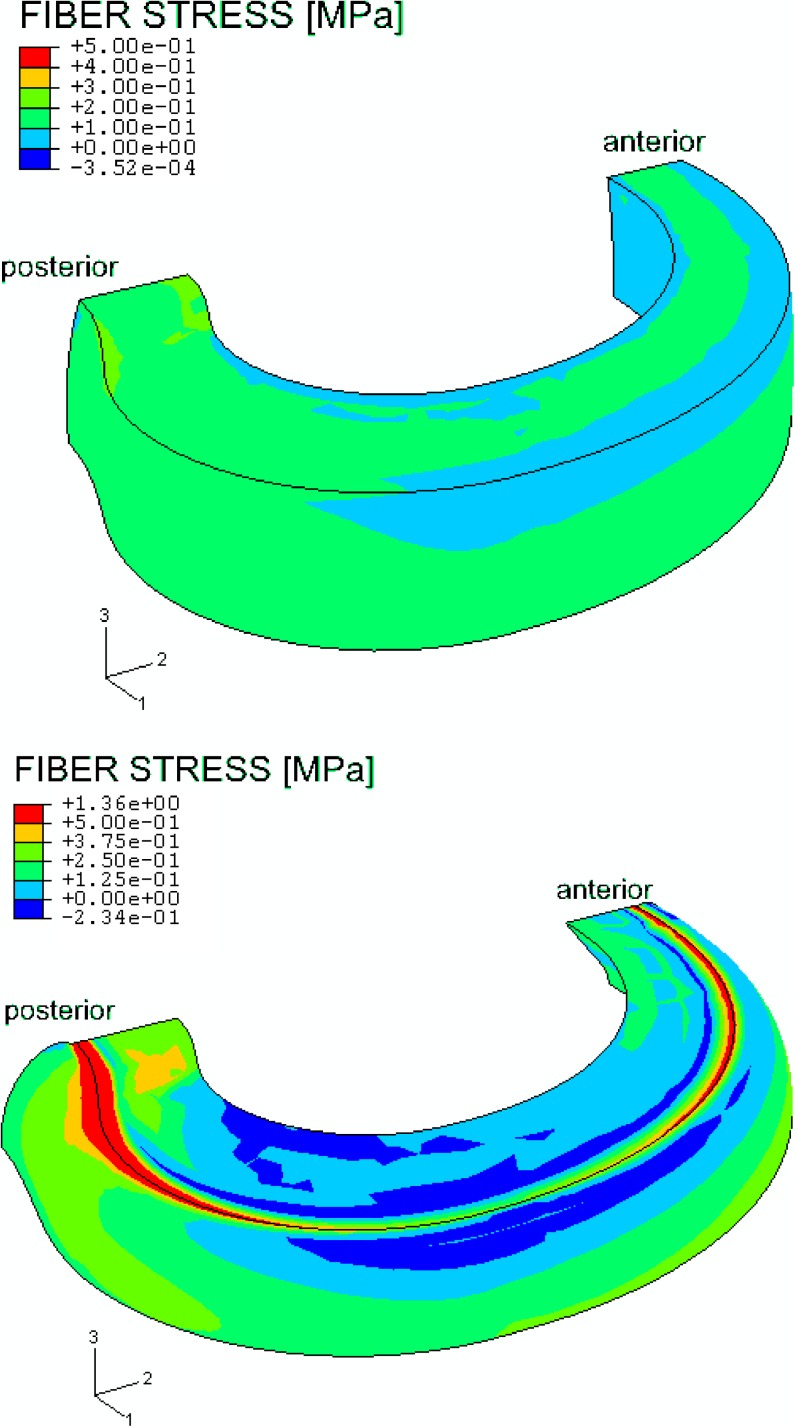
Fig. 6.
Color plot of an unloaded model (top) and an axial loaded model with 1,000 N (bottom) showing the fiber stress in one family of fibers. While unloaded, a prestressing of the collagen fibers in the model during the constrained swelling (step 1) was observed. Because the fiber stress in the nucleus is set to zero, the nucleus was not plotted here

