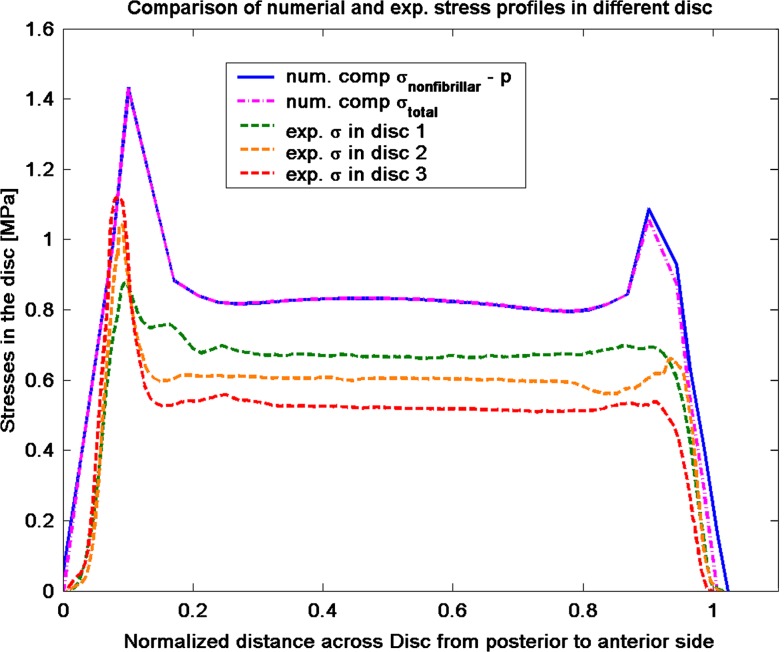
Fig. 7.
Comparison of experimental stress results from McNally and McKinlay (personal communication) of human disc with the numerical predictions of compressive (comp) stress from the presented model. For the total stress
 and the nonfibrillar matrix stress
 minus the hydrostatic pressure (p), stress peaks are seen on the posterior and anterior side of the annulus, while nearly constant stresses are noticed in the nucleus

