
Figure 5. Induction of Klf5 is reduced in Klf5+/− mice compared to WT mice following C. rodentium infection.
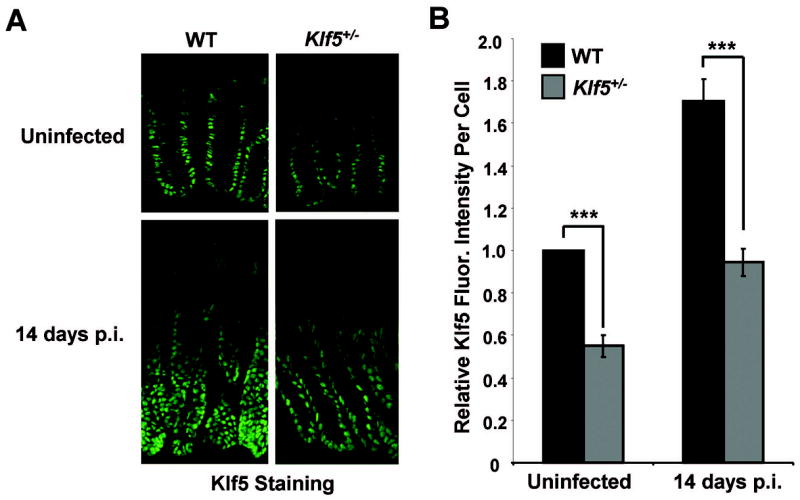
(A) Frozen colonic tissues from uninfected and C. rodentium-infected mice were isolated at 14 days p.i. and stained by immunofluorescence for Klf5 expression. (B) Relative fluorescence intensities per cell were determined by quantitative analysis of images of Klf5 staining. Results represent the mean value of six mice, with the value of each mouse being determined by averaging intensities from at least 200 cells. Results are shown as Klf5 fluorescence intensity per cell relative to intensities in WT mice. ***P < 0.001; n = 6. See Supplemental Figure 3C for a scatter plot of the individual data values.