Figure 4.
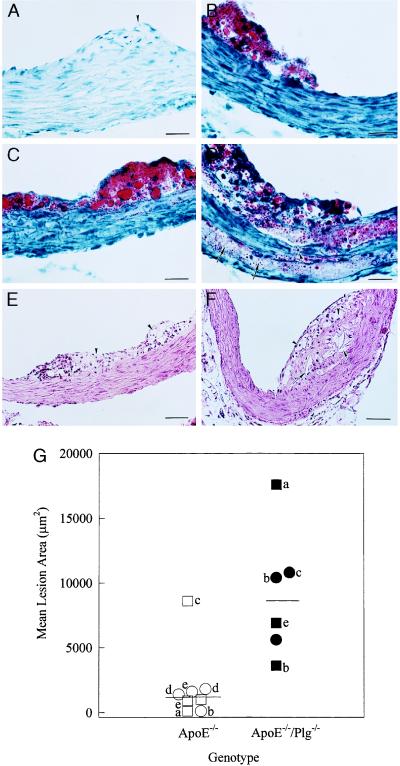
Quantitative and qualitative analyses of lesions within the proximal aortae of ApoE- and Plg-deficient mice. (A) Typical oil red-O stained section from a 20-week-old Plg−/− mouse showing a normal vessel wall in the region around a valve cusp (arrowhead). (B) Section from a 22-week-old ApoE−/− mouse showing a small fatty streak lesion. (C and D) Sections from 22-week-old ApoE−/−/Plg−/− mice displaying a fatty streak (C) and an advanced fibroproliferative lesion (D). Note the substantial lipid deposits deep in the medial layer (arrows) and apparent disruption (arrowhead) of elastic lamina in D. (E) Typical appearance of a proximal aorta lesion in a 25-week old ApoE−/− mouse stained with hematoxylin/eosin. (F) Complex lesion in the proximal aorta of a 20-week-old ApoE−/−/Plg−/− mouse. (G) Mean lesion areas in the proximal aortae of 20-week-old ApoE−/− mice (open symbols) and ApoE−/−/Plg−/− mice (filled symbols). Littermate pairs are indicated by letters. Males and females are indicated by squares and circles, respectively. The median values for both ApoE−/− and ApoE−/−/Plg−/− mice are indicated by bars. The difference in mean lesion areas in the ApoE−/− and ApoE−/−/Plg−/− groups was highly significant using a nonparametric median scores test (P < 0.004). (Bars: A–D = 25 μm; E and F = 50 μm.)

