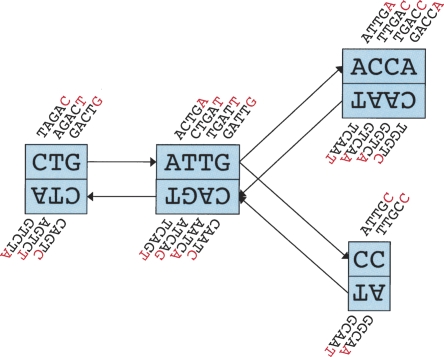
Figure 1.
Schematic representation of our implementation of the de Bruijn graph. Each node, represented by a single rectangle, represents a series of overlapping k-mers (in this case, k = 5), listed directly above or below. (Red) The last nucleotide of each k-mer. The sequence of those final nucleotides, copied in large letters in the rectangle, is the sequence of the node. The twin node, directly attached to the node, either below or above, represents the reverse series of reverse complement k-mers. Arcs are represented as arrows between nodes. The last k-mer of an arc’s origin overlaps with the first of its destination. Each arc has a symmetric arc. Note that the two nodes on the left could be merged into one without loss of information, because they form a chain.

