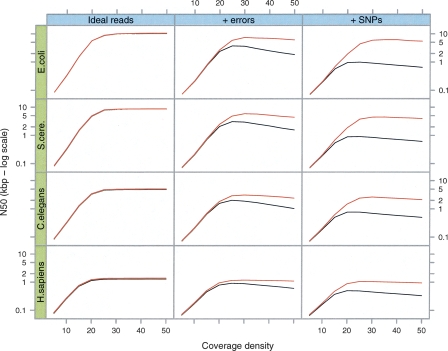
Figure 3.
Simulations of Tour Bus. The genome of E. coli and 5-Mb samples of DNA from three other species (S. cerevisiae, C. elegans, and H. sapiens, respectively) were used to generate 35-bp read sets of varying read depths (X-axis of each plot). We measured the contig length N50 (Y-axis, log scale) after tip-clipping (black curve) then after the subsequent bubble smoothing (red curve). In the first column are the results for perfect, error-free reads. In the second column, we inserted errors in the reads at a rate of 1%. In the third column, we generated a slightly variant genome from the original by inserting random SNPs at a rate of 1 in 500. The reads were then generated with errors from both variants, thus simulating a diploid assembly.

