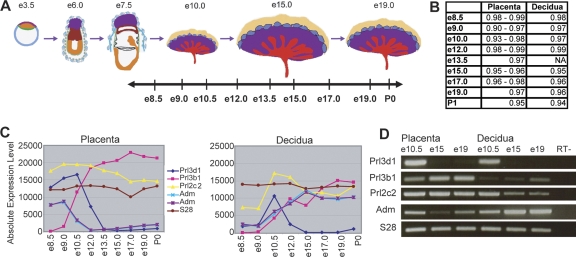
Figure 1.
Genome-wide expression profiling of the fetal and maternal placenta. (A) Samples were taken at nine stages throughout placental development, and dissected into placental and decidual portions. The data set includes biological triplicates for placenta samples at e8.5, e9.0, e10.5, e12.0, e15.0, and e17.0, biological duplicates for placenta samples at e13.5, e19.0, and P0, and biological duplicates for decidual samples at e8.5, e9.0, e10.5, e12.0, e15.0, e17.0, e19.0, and P0. (B) Linear correlation coefficients (r-values) between biological replicates range from 0.90 to 0.99 for fetally derived tissues and from 0.94 to 0.99 for maternally derived tissues, indicating a high degree of correlation between replicate samples at each timepoint. Microarray profiles for known placental hormones correspond with previously published expression patterns (C) and are confirmed by RT–PCR (D) (Linzer et al. 1985; Faria et al. 1991; Yotsumoto et al. 1998; Linzer and Fisher 1999; Soares 2004). Prl3d1 (chorionic somatomammotropin hormone 1); Prl3b1 (chorionic somatomammotropin hormone 2); Prl2c2 (proliferin); Adm (adrenomedullin) (represented by two probe sets). Figure 1A adapted by permission from Macmillan Publishers Ltd.: Nature Reviews Genetics (Rossant and Cross 2001), copyright 2001 (http://www.nature.com/nrg).

