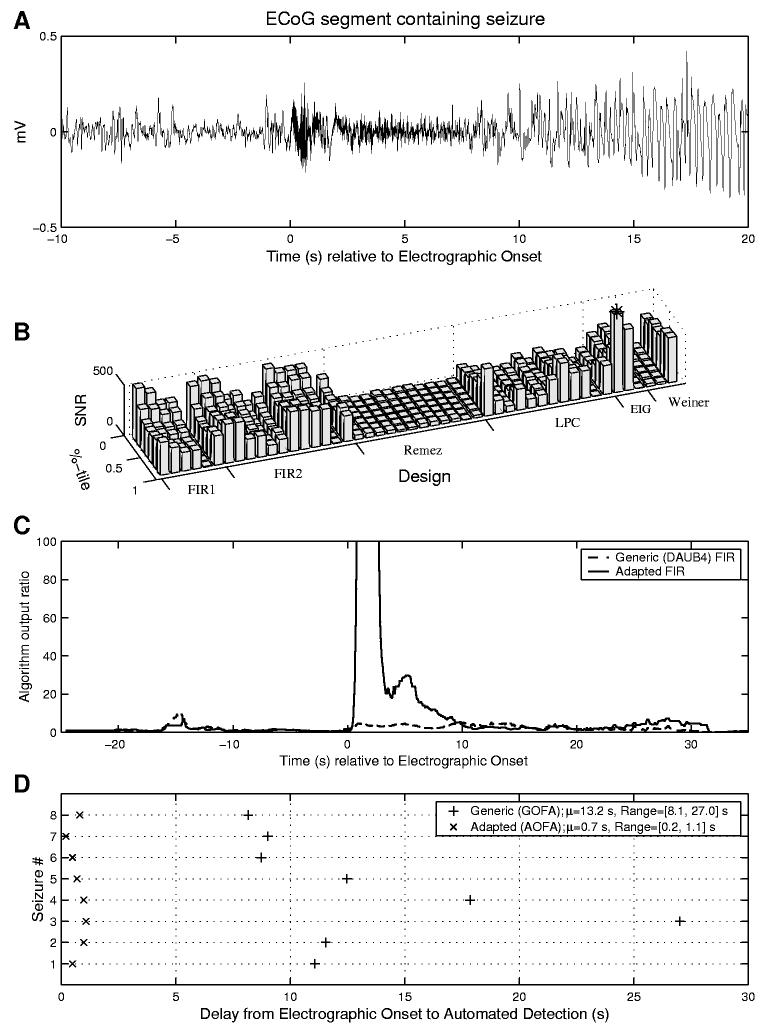
Fig. 3.
(A) Single channel recording containing a seizure onset characterized by a burst of high frequency rhythmic activity (i.e., above 40 Hz); (B) Comparison of the performance (i.e., SNSR) of 48 candidate FIR filters and corresponding percentile levels designed using the seizure and pre-seizure data from (A). The optimal choice for this example is the first eigenfilter design (that maximized the ratio of mean squared filtered seizure to interictal) and a percentile choice of 87.5; (C) Comparison of the algorithm output ratios before and after adaptation; (D) Illustration of the adaptation-induced speedup in detection over 8 seizures for this subject. The mean delay from visually-marked electrographic onset to automated detection was reduced from 13:2s to 0:7s, the standard deviation from 6:35s to 0:31s., and the range from [8:1, 27:0] to [0:2, 1:1].

