


Table 2. Refinement statistics.
| Non-H atoms | |
| Protein | 492 |
| Glycerol | 6 |
| Solvent (H2O) | 115 |
| Resolution (Å) | 0.85 |
| Rwork† (%) | 13.1 |
| Rfree†‡ (%) | 15.0 |
| Reflections used in Rwork calculations | |
| No. of reflections | 2107 |
| Completeness (%) | 86.0 |
| R.m.s.d.s from ideal geometry | |
| Bonds (Å) | 0.03 |
| Angles (°) | 2.4 |
| Dihedrals (°) | 24.9 |
| Impropers (°) | 1.7 |
| Bonded B (Å2) | |
| Main chain | 1.3 |
| Side chain | 2.2 |
| Mean isotropic B (protein) (Å2) | 10.3 |
| Main chain | 9.0 |
| Side chain | 11.6 |
| Mean isotropic B (solvent) (Å2) | 25.3 |
| Mean isotropic B (glycerol) (Å2) | 14.1 |
| Residues in Ramachandran plot (%) | |
| Most favoured regions | 90.4 |
| Additional allowed regions | 9.6 |
†
R = 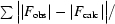
 , where F
obs and F
calc are the observed and calculated structure-factor amplitudes, respectively.
, where F
obs and F
calc are the observed and calculated structure-factor amplitudes, respectively.
‡
R free was calculated with 5% of the diffraction data that were selected randomly and not used throughout refinement.