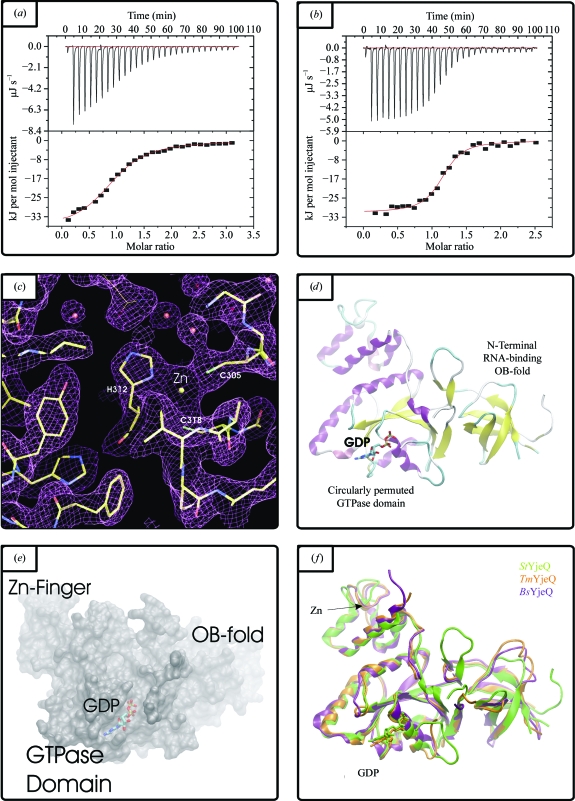
Figure 2.
(a) and (b) Representative thermograms from isothermal calorimetric analysis of StYjeQ for (a) GTP binding and (b) GDP binding. (c) Representative electron density in the zinc-finger region of StYjeQ (chicken-wire representation of 2F obs − F calc density map contoured at 1σ, with waters shown as red spheres and the Zn2+ ion as a yellow sphere). The StYjeQ model is shown in stick format, with the thinner tracing indicating a side chain from a symmetry-related molecule. (d) Cartoon-format Cα trace of StYjeQ, illustrating domain structure and the location of the GDP- and Zn2+-binding sites. (e) 1.4 Å probe-radius SURF plot of the StYjeQ surface, showing the position of the bound GDP and illustrating the relationship between the binding cleft and the adjacent OB-fold domain. (f) Cartoon-format three-way alignment of YjeQ orthologues: StYjeQ (green), TmYjeQ (orange) and BsYloQ (purple) Cα traces.

