
Figure 3. Kinetic differences in the increases in [Na+]i, [Ca2+]i and pHi induced by speract (A) and FSG (B).
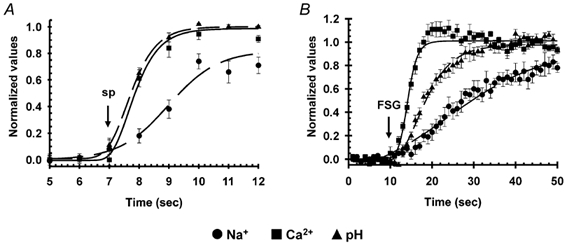
The results shown are averages of at least six experiments (± s.e.m.) performed as indicated in Fig. 2. The difference between the time constant (τ1/2) values of the pHi and [Ca2+]i changes induced by speract are statistically different (*P < 0.05; see Table 2).