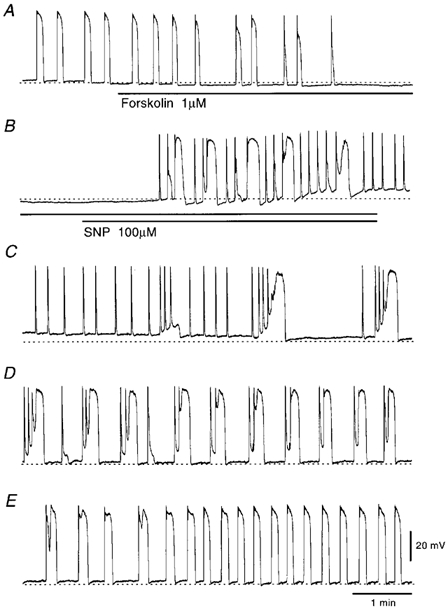
Figure 3. Effects of SNP on pacemaker potentials in the presence of forskolin.

Pacemaker potentials recorded in response to 1 μm forskolin (A) and subsequent 100 μm SNP in addition to forskolin (B). C, D and E are responses of pacemaker potentials recorded during wash out of forskolin and SNP for 9 min, 24 min and 33 min, respectively. The resting membrane potential was −65 mV. All traces are continuous with some interruptions.
