
Figure 1. Transgenic diaphragm muscle displays exaggerated contraction fatigue in tetanic nerve stimulation.
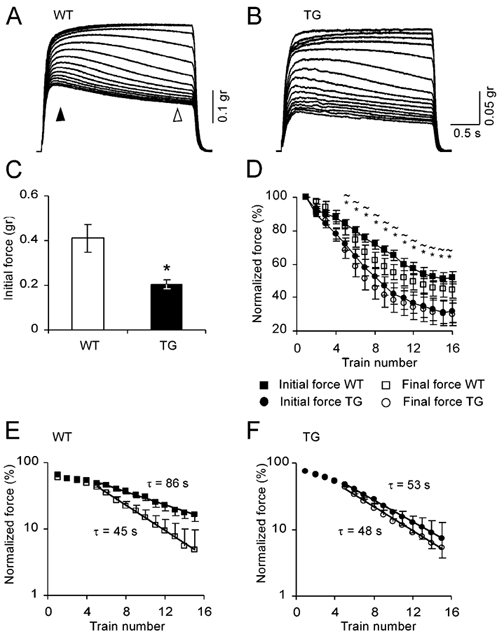
A, nerve induced contractions in WT diaphragm muscle. Contraction sessions were composed of 15 consecutive stimulation trains of 200 stimuli at 66 Hz, with 10 s intertrain intervals. B, similar to A in TG diaphragm muscle. C, averaged initial force of 6 measurements in each of 4 WT and 5 TG diaphragms (measured at the time marked by a filled arrowhead in A, means ± s.e.m.). *P < 0.05, compared with WT group, two-tailed t test. D, time course of initial and final forces normalized to the first contraction (final force was measured at the time marked by an open arrowhead in A). *P < 0.05, initial forces compared with WT values; ≈P < 0.05, final forces compared with WT values. E, semi-logarithmic plot for WT initial and final forces (steady state values subtracted). Time constants derived from the slope of the line fitted by regression to the linear part were found to be significantly different (F test, P < 0.05). F, same as E for TG muscles.