
Figure 2. Transgenic diaphragm muscle displays exaggerated contraction fatigue in tetanic direct muscle stimulation.
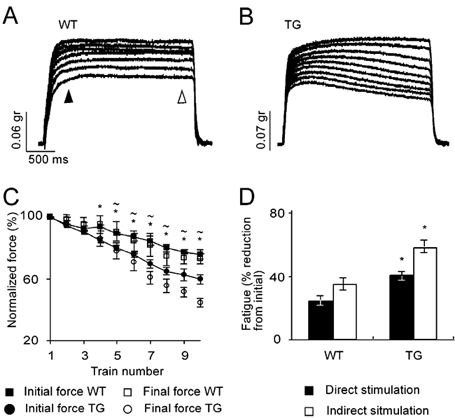
A, contractions in WT diaphragm muscles induced by delivering the stimulation directly into the muscle. The contraction session was composed of 10 consecutive stimulation trains of 200 stimuli at 66 Hz, with 10 s intertrain intervals. B, same as A for TG muscle. C, time course of initial and final forces normalized to the first contraction. Values are means ± s.e.m. of 6 measurements in each of 3 WT and 3 TG diaphragms. Forces were measured at the time marked by the filled and open arrowheads in A. *P < 0.05, initial forces compared with WT values; ≈P < 0.05, final forces compared with WT values. D, summary of the muscle- and nerve-induced fatigue, measured at the 10th contraction in direct and indirect stimulation. Note similar ratio of muscle- and nerve-induced fatigue in the TG and WT muscles. Data are given as means ± s.e.m. *P < 0.05, compared with WT group, two-tailed t test.