
Figure 3. TG synapses demonstrate pronounced neurotransmission depression in cut muscle preparations.
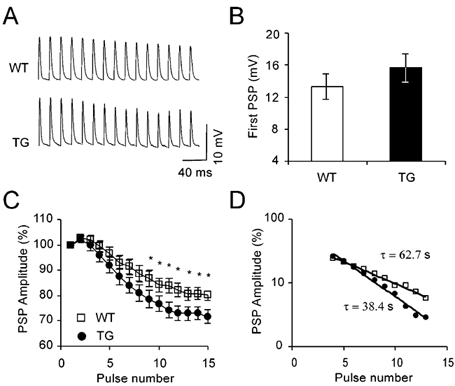
A, examples of trains of PSPs evoked in cut muscle preparations. Trains consisted of 15 stimuli at 50 Hz with 10 s intertrain intervals. For clarity, stimulation artifacts were omitted. B, average amplitude (± s.e.m.) of the first PSP in the train. In order to reduce PSP variability resulting from differences in membrane potentials, amplitudes were scaled to a driving force at a membrane potential of - 50 mV, assuming zero as the synaptic reversal potential (Linder & Quastel, 1978). n = 44 and 45 cells from 9 WT and 9 TG muscles. C, time course of PSP decay during the train. PSPs are normalized to the first PSP in the train. *P < 0.05, compared with WT group, two-tailed t test. D, semi-logarithmic plot of PSP values (extrapolated steady state levels were subtracted). Time constants derived from the slope of the regression. P < 0.05 (F test).