
Figure 4. TG quantal size is similar to WT responses in control conditions, but larger following physostigmine treatment.
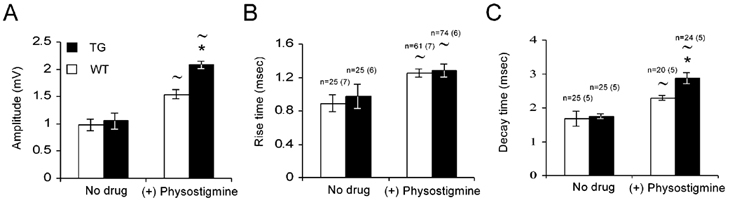
Quantal size recorded in WT and TG muscles under conditions of low probability of release (0.2 mm Ca2+, 2.3 mm Mg2+). Evoked and spontaneous responses were combined (see Methods). A sample of PSPs from several cells was taken in the presence of physostigmine (10 μm). A, PSP amplitude. B, PSP rise time (from onset to peak). C, PSPs half-decay time (from peak to half-decay). Numbers of cells analysed are indicated above the bars, number of animals in brackets (similar numbers for A and B). Data were analysed with an unpaired two-tailed t test: *P < 0.05, compared with WT results; ≈P < 0.05, compared with no drug conditions within the same group.