
Figure 5. TG synapse displays higher probability of release and different susceptibility to AChE inhibition than WT.
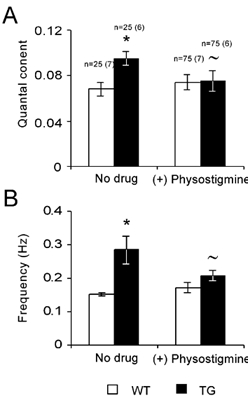
A, quantal content of WT and TG synapses, measured at conditions of low probability of release (0.2 mm Ca2+, 2.3 mm Mg2+) with and without physostigmine (10 μm). B, frequency of spontaneous release with and without physostigmine. Numbers of cells analysed are indicated above the bars, number of animals in brackets (similar numbers for A and B). Data were analysed with a two-tailed t-test: *P < 0.05, compared with WT results; ≈P < 0.05, compared with no drug conditions within the same group.