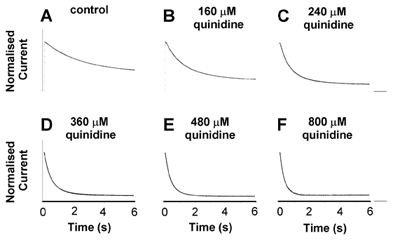
Figure 7. Quinidine binding kinetics.

Six second depolarising steps from −90 to +50 mV were applied at a frequency of 0.03 Hz. Recordings were made in 2 mm[K+]o with between 0 and 800 μm quinidine. For comparison, all current traces were normalised to the peak values under control conditions. The smooth continuous line superimposed on each trace is the best fit of an exponential function, used to determine the inactivation time constant(s). The control trace was best fitted by a mono-exponential function (A), whereas in the presence of 160-800 μm quinidine, inactivation was best fitted by a bi-exponential function (B-F).
