
Figure 2. Comparison of action potentials between CTL and ORC mouse ventricular myocytes.
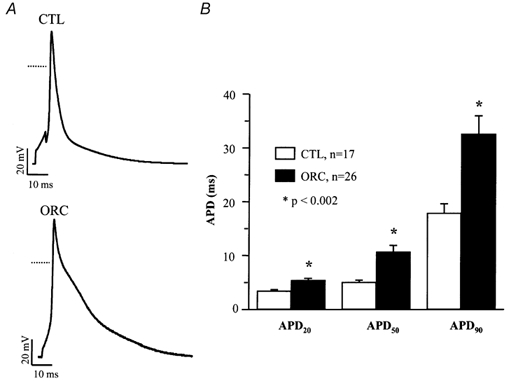
A, typical examples of action potentials recorded from CTL and ORC mice. Dotted lines represent the 0 mV level. B, mean APD at 20 %, 50 % and 90 % of repolarization in CTL and ORC mice. Action potentials were recorded at a frequency of 4 Hz. Recordings shown in this and all subsequent figures were measured at room temperature.