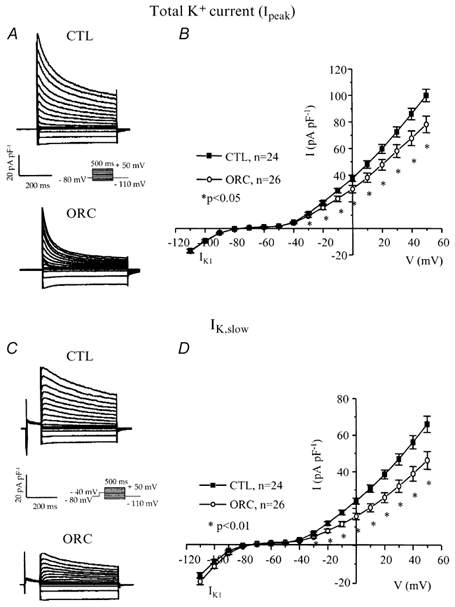
Figure 3. Comparison of total K+ current (Ipeak) and IK,slow (IK,ur+Iss) between CTL and ORC mouse ventricular myocytes.

A, family of K+ currents recorded from CTL and ORC myocytes. Membrane currents were activated using the voltage protocol shown in the inset. B, mean I-V relationships for the total K+ current (Ipeak) in CTL and ORC ventricular myocytes. C, superimposed current traces of IK,slow in CTL and ORC cells. IK,slow was activated by 500 ms voltage steps preceded by a 100 ms inactivating prepulse to −40 mV. D, mean I-V curves for IK,slow recorded from CTL and ORC mice. Note that the current densities of IK1, which was activated by voltage steps ranging from −110 mV to −40 mV, were similar between ORC and CTL mice.
