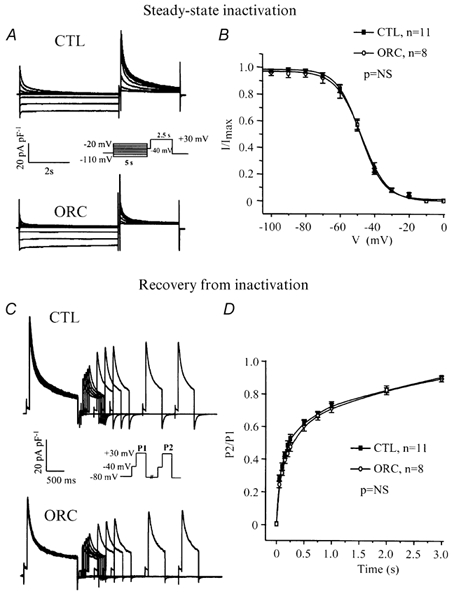
Figure 6. Comparison of kinetic parameters for IK,ur between CTL and ORC ventricular myocytes.

A, superimposed current records showing voltage dependence of steady-state inactivation for IK,ur in CTL and ORC myocytes. The cells were held at various test potentials varying from −110 to −20 mV for 5 s. A 2.5 s voltage step to +30 mV preceded by an inactivating prepulse (at −40 mV for 100 ms) was then applied to measure the remaining current. B, graph comparing the voltage dependence of steady-state inactivation of IK,ur between CTL and ORC mice. I/Imax is the current normalized to the current obtained with the −110 mV voltage step. Smooth lines are best-fit Boltzmann functions. C, family of current recordings showing the time course of recovery from inactivation for IK,ur in CTL and ORC cells. Two voltage steps (+30 mV; P1 = 1500 ms, P2 = 500 ms) separated by 50, 100, 150, 200, 250, 500, 750, 1000, 2000 and 3000 ms were applied. Both steps were preceded by the Ito inactivating prepulse. D, graph comparing reactivation of IK,ur between CTL and ORC myocytes. P2/P1 represents the ratio of the amplitude of the current generated by each pulse.
