
Figure 1. Immunostaining of neurones to show Nav1.7 in rat and guinea-pig DRGs.
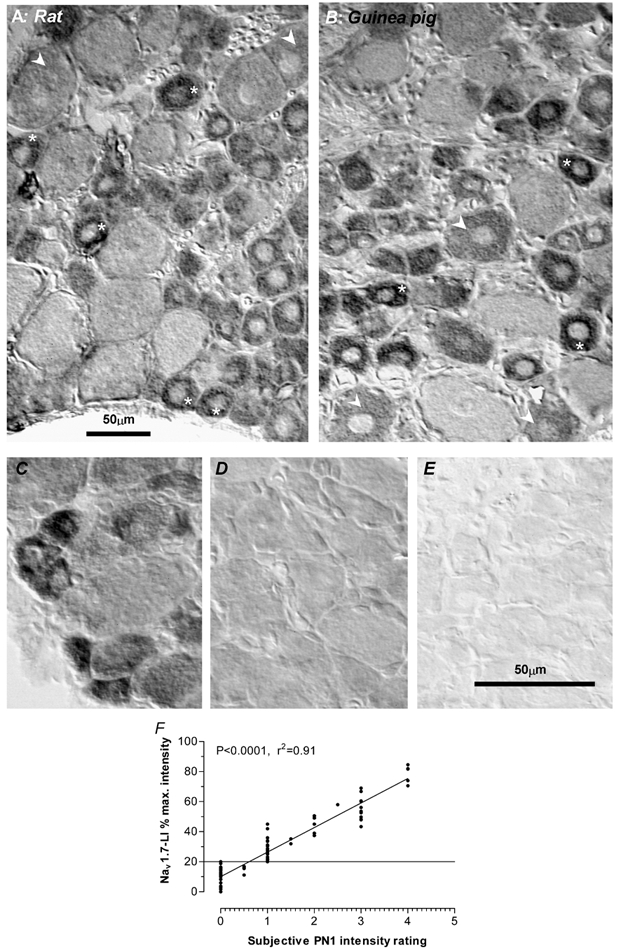
A and B compare the staining with anti-Nav1.7 antibody of rat (A) and guinea-pig (B) DRG sections on the same slide. The small cells were the most intensely stained (asterisks), medium sized cells often had an intermediate staining intensity (arrowheads) and the palest staining profiles were usually of large neurones. These images were captured under bright field optics with interference contrast to aid visualisation of the paler staining neurons, although image analysis was always carried out on bright field images. C, D and E, sections of the same guinea-pig L6 DRG on which immunocytochemistry was carried out simultaneously with the following primary antibody: C, normal anti-Nav1.7 antibody; D, anti-Nav1.7 antibody was pre-absorbed for 3 h prior to use with 5 × 10⁻⁵m of the peptide against which the antibody had been generated; E, no primary antibody. F, the relationship between subjectively judged relative intensity (abscissa) and the calculated relative intensity (ordinate) (see Methods); 20 % relative intensity or above was consistently judged to be clearly positive.