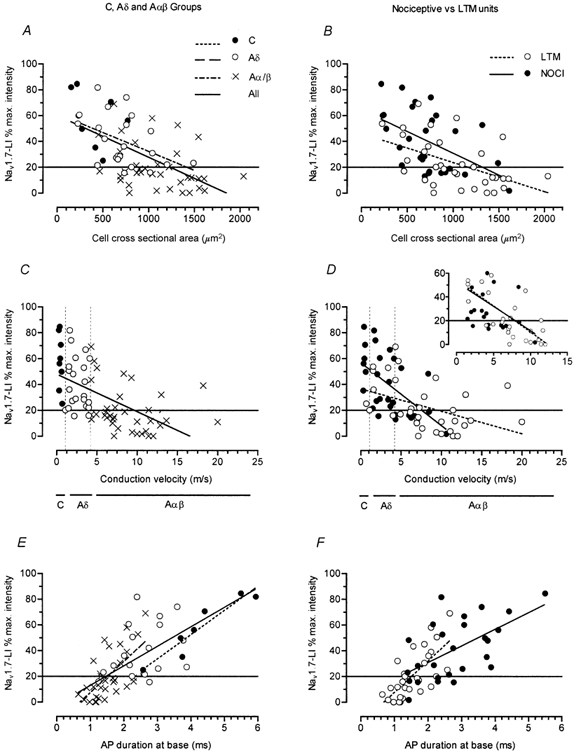
Figure 5. Graphs of Nav1.7-LI intensity against neuronal properties.

Neuronal properties plotted against Nav1.7-LI intensity are cell size (the cross-sectional area of the largest section through the neurone; A and B); dorsal root CV (C and D); and AP duration (the duration at base of somatic APs evoked by electrical stimulation of the dorsal root; E and F). The horizontal line at 20% indicates the relative intensity above which cells are considered positive for Nav1.7. The inset in D shows superimposition of the lines for nociceptive (NOCI) and low threshold mechanoreceptive (LTM) units when only units with CVs of 1.1-12 m s−1 were included (see text). On the left, units are subdivided into those with C- (•), Aδ- (○) or Aα/β-fibres (×); in these groups nociceptive and non-nociceptive units, and cooling-sensitive units were included. Unresponsive units were excluded. Linear regression analysis was carried out on each of these CV groups separately and on all units together, and regression lines are included only where there was a significant correlation. On the right, only nociceptive (•) and LTM units (○) are included; thus fewer units are plotted. Linear regression analysis was carried out on nociceptive and LTM units separately. The keys to symbols and lines may be found in A (for A, C and E) and B (for B, D and F). For significant linear correlations (P < 0.05), regression lines are shown here and the P and r2 values are shown in Table 1.
