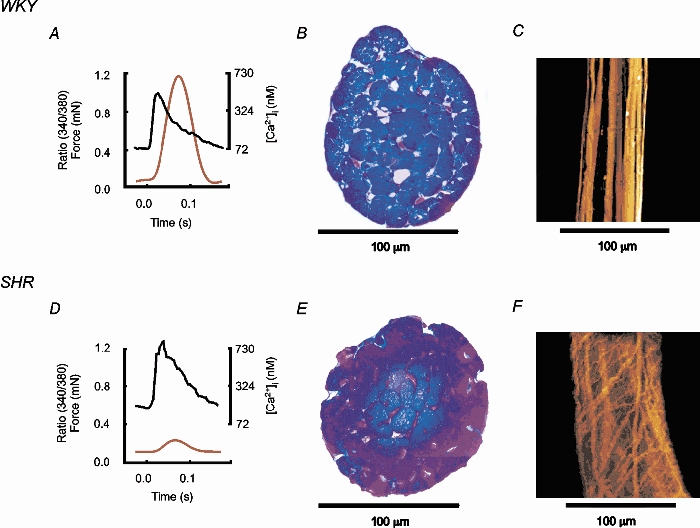
Figure 5. Morphometric analysis of LV trabeculae.

Examples of force, [Ca2+]i (5 Hz frequency, 2 mm[Ca2+]o, 37 °C, sarcomere length: 2.1 μm) and collagen distribution in representative LV trabeculae of similar dimensions from WKY (top) and SHR (bottom). A and D, averaged 340 nm/380 nm ratios and force. B and E, transversely sectioned trabeculae, stained blue for myocytes and pink for collagen. WKY trabecula: 2 % collagen, SHR trabecula: 7 % collagen. C and F, trabeculae in longitudinal section (extended focus to a depth of 50 μm) stained for collagen.
