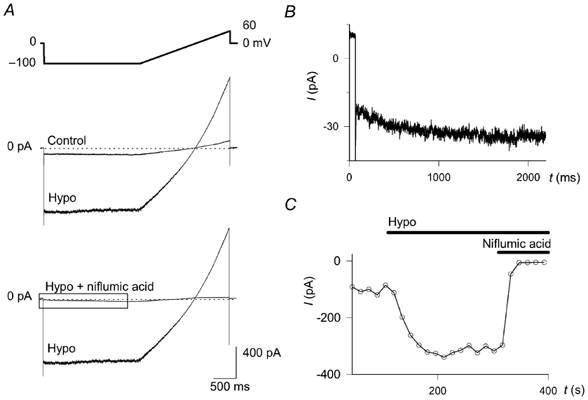
Figure 6. Swelling-activated chloride current.

The chemoreceptor cells were examined with the patch-clamp technique in the whole-cell voltage-clamp configuration. A, the upper panel shows the voltage protocol. Step hyperpolarisations from a holding potential of 0 to – 100 mV were applied every 15 s for 2 s, followed by a ramp depolarisation up to 60 mV within 2 s. The effect of decreasing osmolality from 310 (Control) to 260 mosmol kg−1 (Hypo) and that of subsequently applied niflumic acid (300 μm) are shown in the middle and bottom panels, respectively (n = 17 and 9, respectively). The current trace enclosed by the box in the lower panel is shown enlarged in B. B, the hyperpolarisation-activated current can be seen after inhibiting the swelling activated current with niflumic acid (300 μm). C, the kinetics of the effect of hyposmosis (Hypo). The current intensity, averaged between 40 and 60 ms after applying the hyperpolarising step (i.e. before the time-dependent activation, shown in B) is shown as function of time.
