
Figure 6. Comparison of blood flow as measured by spheres in eight regions of the parietal cortex (n = 7).
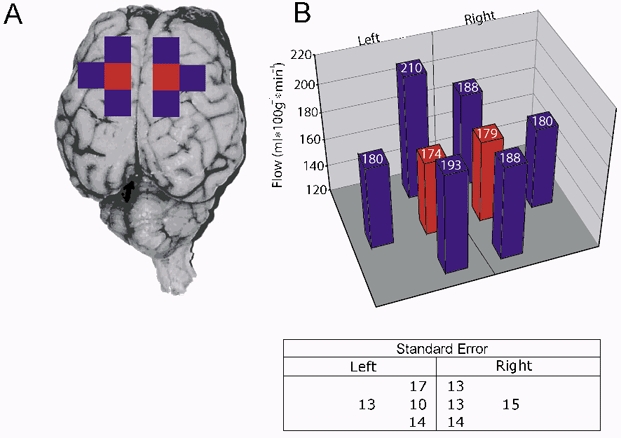
A, regions consisted of neighbouring 12 mm3 cubes from the right and left sides. Significant differences were not detected. B, values indicate millilitres per minute per 100 gram of tissue.