
Figure 2. Changes in[Ca2+]i, tension and MLC20 phosphorylation due to PGF2α under normal conditions or conditions where an increase in [Ca2+]i was inhibited.
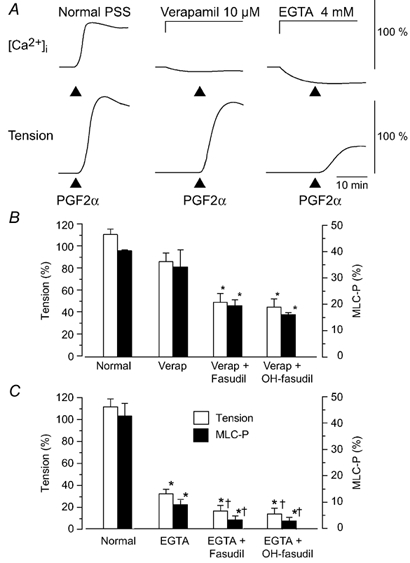
A, examples of changes in[Ca2+]i in normal physiological saline solution (PSS), in the presence of verapamil (10 µm) or EGTA (4 mm). For[Ca2+]i and tension, 100 % represents the change induced by 65.4 mm KCl, which was obtained before the application of PGF2α. Verapamil or EGTA was applied 10 min before the addition of PGF2α (10 µm). B, summarized data of the PGF2α-induced contraction and MLC20 phosphorylation in the normal medium or in the presence of verapamil and fasudil or hydroxyfasudil (OH-fasudil). Developed tension is expressed as a percentage of the maximum contraction to 65.4 mm KCl. C, summarized data of the PGF2α-induced contraction and MLC20 phosphorylation in the normal medium or in the presence of EGTA and fasudil or OH-fasudil. In B and C, MLC20 phosphorylation (MLC-P) was measured at 5 min after the addition of PGF2α (10 µm). When used, fasudil (10 µm) or hydroxyfasudil (OH-fasudil, 10 µm) was added 30 min before PGF2α. The protocol in B and C was the same as that shown in A, but the experiments were performed in a different series. MLC20 phosphorylation under the resting condition in normal PSS was 8.9 ± 2.4 % (data not shown). Verap: verapamil.