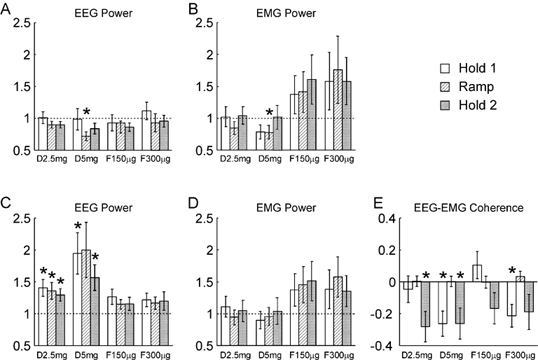
Figure 2. Comparison of different measures following successive drug doses with the same measures made during the control experiment, for the auxotonic task.

A and B refer to the 8.75–11.25 Hz band, C-E to the 17.5–27.5 Hz band. A and C, the EEG power; B and D, the EMG power. Power has been expressed relative to that seen in the control experiment; a ratio of one (dotted line) would indicate no change. E, EEG-EMG coherence, expressed as a difference between the Z-transformed values following drug administration and the control. Different shading indicates measurements made during the three phases of the task, according to the key at the top right of the figure. Labels D2.5 mg, etc. indicate different drug doses (see legend to Fig. 1). Error bars show 1 standard error of the mean; asterisks indicate a measure significantly different from that during the control period (P < 0.05). Analysis was across n = 8 subjects for A and C, n = 40 subjects and muscles for B, D and E.
