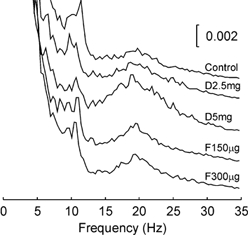
Figure 3. EEG power spectra with high frequency resolution calculated over the Hold 2 period of the auxotonic task.

Power is expressed as a fraction of the total power at all frequencies, and is averaged across eight subjects. Each trace shows the result following a different drug dose, using the same labelling as in Fig. 1.
