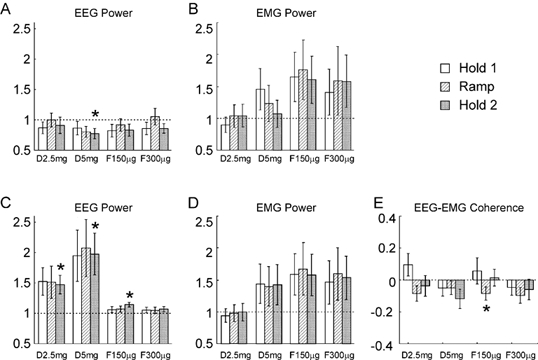
Figure 5. Comparison between the measurements made following drug administration with those from the control experiment, for the isometric task.

A and B refer to the 8.75–11.25 Hz band, C-E to the 17.5–27.5 Hz band. A and C, the EEG power, B and D, the EMG power, E, EEG-EMG coherence. Display conventions as in Fig. 2.
