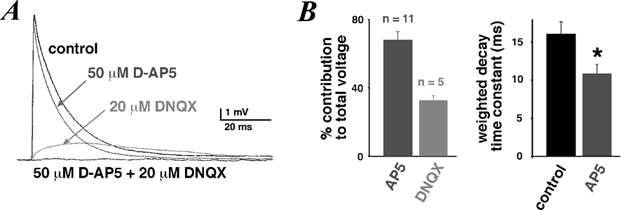
Figure 3. NMDA and non-NMDA components of unitary EPSPs.

A, average EPSPs recorded in a cell in control, 50 µm d-AP5 and/or 20 µm DNQX. The holding potential was −60 mV. B, percentage contribution to the total integrated control voltage of residual EPSPs after perfusion of 50 µm d-AP5 or 20 µm DNQX integrated over 100 ms after onset. Mean weighted decay time constant of average EPSPs in control and 50 µm d-AP5 (n = 5, the difference between the two groups was significant, unpaired t test, P < 0.05).
