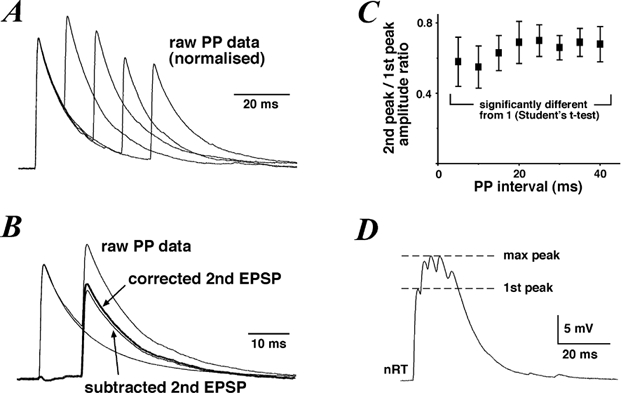
Figure 5. Paired-pulse depression at VB to nRT connections.

A, example traces of paired-pulse (PP) data normalised at the peak of the first EPSP. Each trace is the average of 5 paired EPSPs. B, example PP trace illustrating the method employed for estimating the 2nd peak/1st peak ratio. Single EPSP traces were subtracted from PP data and the resulting EPSP traces were corrected for a decrease in driving force by linear extrapolation of the amplitude back to resting voltage. C, plot of the 2nd peak/1st peak ratio against the PP interval, showing that PP depression persists for over 40 ms. D, example trace of a burst of EPSPs recorded in an nRT neurone in response to a burst of APs evoked in the presynaptic VB cell. The first EPSP peak and maximal burst peak are highlighted by a dashed line.
