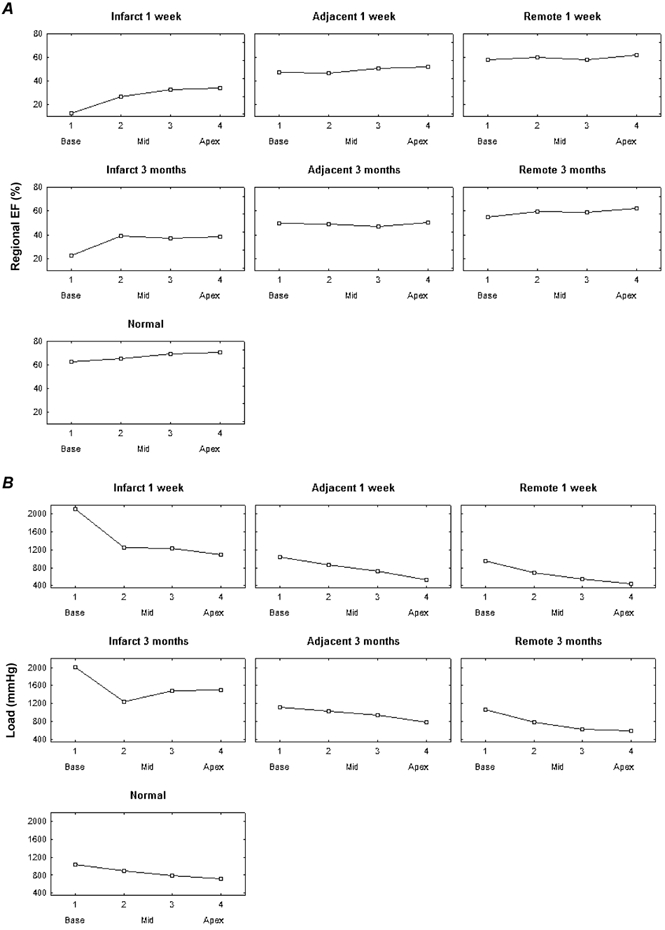
Figure 7. Distribution of regional EF (A) and load (B) along the long axis of the ventricle.

Data shown for normals and infarct patients in the different regions (remote, adjacent, infarcted) at 1 week and 3 months. Four levels from base to apex are shown: 1 base, 4 apex.
