
Figure 2. Effects of Ba2+ on the Kir currents.
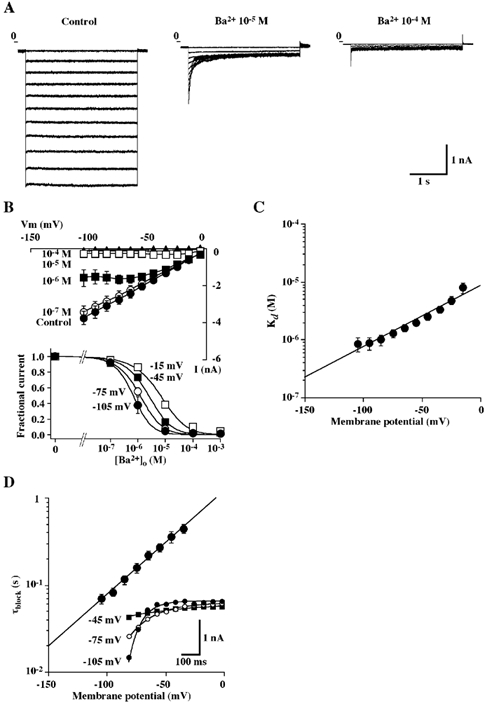
A, representative tracings of whole-cell currents obtained from a single BPA cells in the absence and the presence of Ba2+ (10−5 and 10−4m) in the bathing solution containing 150 mm KCl (solution C). Currents were elicited by voltage steps ranging from −105 to −5 mV in 10 mV increments, each of 3 s duration. Voltage pulses were separated by a 7 s interval and holding potential was −5 mV. B, upper panel, steady-state I-V relationships of whole-cell currents recorded from BPA cells in the presence of 150 mm KCl with varying concentrations of extracellular Ba2+. Steady-state whole-cell currents were measured at 3 s from the start of each voltage pulse. Each point represents the mean ± s.e.m. of 5 experiments. Lower panel, fractional current at steady-state plotted against Ba2+ concentration at a holding potential of −105, −75, −45 or −15 mV. Each point represents the mean ± s.e.m. of 5 experiments. The lines are fits to the Hill equation (eqn (2)). C, Ba2+ concentration dependence of the steady-state block of whole-cell currents at different holding potentials. Each point represents the mean ± s.e.m. of 5 experiments. The line is the fit to eqn (3). D, plot of the blocking time constant as a function of membrane potential. The data points were obtained in the presence of 10−5m Ba2+ and represent means ± s.e.m. of 5 experiments. Inset, representative traces of the currents obtained from a single BPA cell. The currents were elicited by voltage steps to −105, −75 and −45 mV from a holding potential of −5 mV in the presence of 10−5m Ba2+ in the bathing solution. The lines are the fit to a single exponential using a least-squares method.