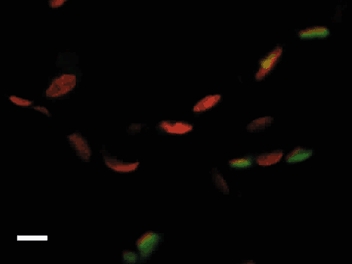
Figure 6. Photomicrograph showing a confocally acquired image of control lung tissue.

Nuclei were stained with Propidium Iodide (red) while endothelial cells were stained using anti-VEGFR-2 antibody visualised using FITC (green). Scale bar represents 10 µm.
