
Figure 2. Mean sway response for all subjects.
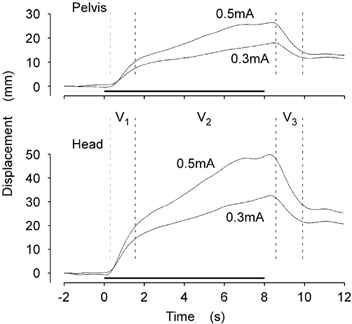
The group mean lateral displacement at the pelvis (top) and head (bottom) are shown for the 0.3 and 0.5 mA stimuli. GVS was applied for the period indicated by the horizontal lines (0–8 s). Visual inspection revealed three distinct phases of the response (V1, V2, V3).