
Figure 3. Step-plus-ramp model of the response.
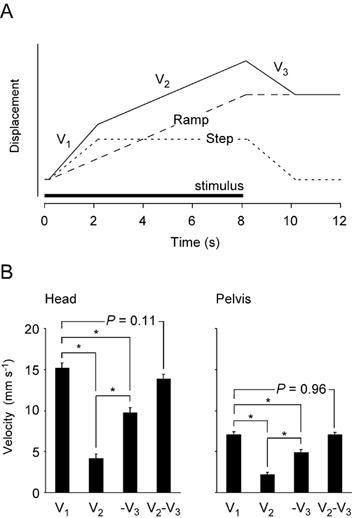
A, the response (continuous line) was modelled as the sum of a step or position response (dotted line) and a ramp or velocity response (dashed line). The step response was assumed to have the same onset and offset speeds, as determined by the GVS response and movement dynamics of the body. The model was tested with the responses from individual subjects by comparing the movement velocities during the periods V1, V2 and V3. B, mean sway velocities in the direction of the anode are shown for each phase of the response (V1, V2, V3, mean ± s.e.m.). Data are shown for the head (left) and pelvis (right). The data were calculated individually and averaged across the subjects group. Negative V3 is shown because it was the movement in the reverse direction when the stimulus stopped. V1 was not shown to be significantly different from the sum of V2 and -V3, a result consistent with the step-plus-ramp model.