
Figure 4. Responses of individual subjects.
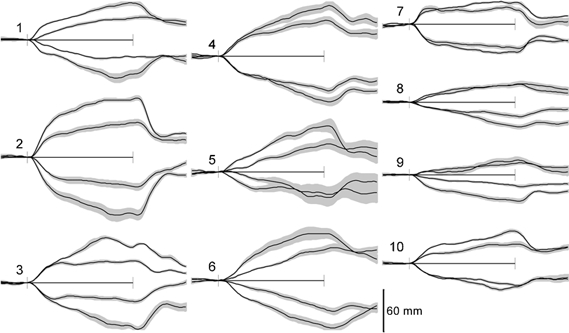
The sway responses (mean of 16 trials ± s.e.m.) for the 10 subjects, with the anode-right above the axis (movement R) and anode left below the axis (movement L). For every subject, the smaller response is for the 0.3 mA stimulus and the larger for the 0.5 mA stimulus. The records are for 14 s, with the 8 s period of the stimulus indicated between the axis markers.