
Figure 3. The αCTxGI-resistant depolarization by choline and ACh in denervated muscle of C57BL/6J mice.
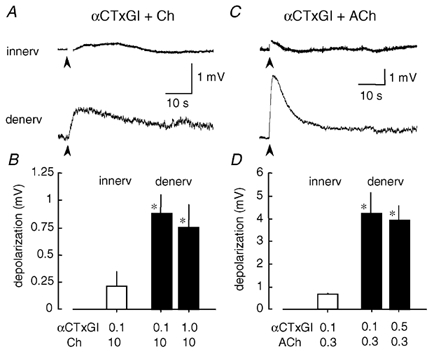
All the data were obtained after treatment with αCTxGI in mouse soleus muscles. A, traces showing averaged response to 10 mm choline (Ch) in the presence of 0.1 µmαCTxGI in the innervated (innerv) and denervated (denerv) muscles (n = 10–17, 4–5 muscles). Stimulation artifacts just after the agonist applications (arrowheads) are blanked. B, peak amplitude of 10 mm choline-evoked depolarization in the presence of αCTxGI (0.1–1 µm) in the innervated and denervated states. Data values represent the means ± s.e.m. (n = 10–17). C, traces demonstrating averaged response to 0.3 mm ACh in the presence of 0.1 µmαCTxGI in the innervated and denervated muscles. Stimulation artifacts are blanked (n = 3–6, 3 muscles). D, peak amplitude of 0.3 mm ACh-evoked depolarization in the presence of αCTxGI (0.1–0.5 µm) in the innervated and denervated states. Data values represent the means ± s.e.m. (n = 3–6). *Significantly different response (P < 0.05) to choline or ACh in the presence of 0.1 µmαCTxGI in the denervated muscles from those in the innervated muscle, determined by unpaired t test.