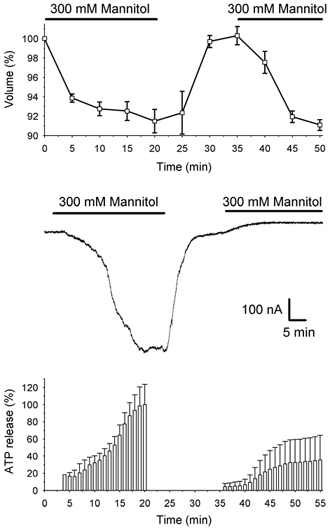
Figure 3. Effect of two consecutive hypertonic shocks on cell volume, inward current and ATP release.

Upper graph: decrease in cell volume in 6 oocytes superfused twice (indicated with horizontal bars) in hypertonic solution. Middle trace: example of ionic currents recorded in one oocyte clamped at Vm=−70 mV in which two consecutive hypertonic superfusions (indicated with horizontal bars) were applied. Lower graph: percentage of ATP release with respect to the maximal release measured after the first period of 20 min of hypertonic perfusion (n = 3).
