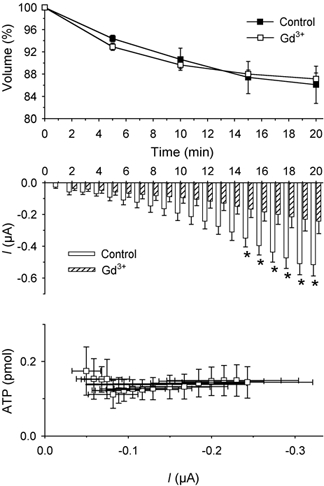
Figure 6. Effect of gadolinium on cell volume, membrane current and ATP release during a hypertonic shock.

Upper graph: decrease in cell volume in oocytes superfused in hypertonic solution. The value at time 0 was set at 100 %. •, hypertonic solution (n = 6); ○, hypertonic solution plus 200 µm GdCl3 (n = 6). Middle graph: average of current amplitudes during 1 min of recording. □, non-treated oocytes (n = 33);  , gadolinium-treated oocytes (n = 11). *P < 0.05. Lower graph: plot of ATP release vs. current and time (each point represents the ATP release vs. current amplitude during each minute of recording from minute 4 to minute 20) showing the inhibition of ATP release and the hypertonic shock-activated currents.
