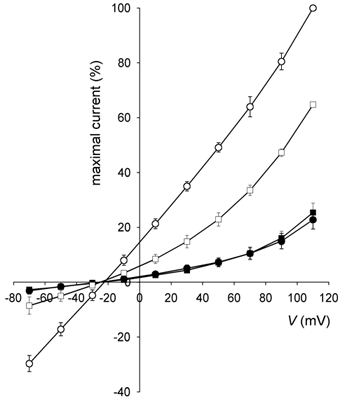
Figure 7. I-V relationship of hypertonic shock-activated currents.

Current amplitudes are represented as a percentage of the amplitude of the current measured in non-treated oocytes in hypertonic medium at +110 mV. Circles: non-treated oocytes (n = 6) in isotonic (•) and hypertonic (○) media. Squares: gadolinium-treated oocytes (n = 6) in isotonic (▪) and hypertonic (□) media.
