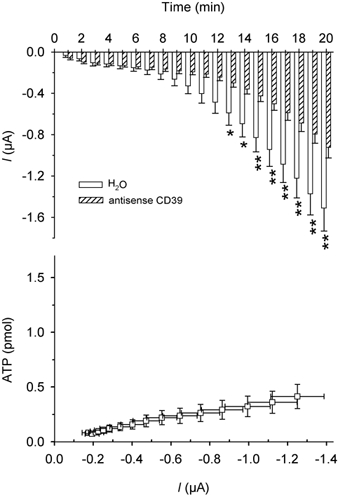
Figure 10. Hypertonic shock-activated membrane currents and ATP release in oocytes injected with an antisense oligonucleotide complementary to CD39 mRNA.

Upper graph: average of current amplitudes during 1 min of recording. □, water-injected oocytes (n = 8);  , CD39 antisense-injected oocytes (n = 13). *P < 0.05, **P < 0.01. Lower graph: plot of ATP release vs. current and time in CD39 antisense-injected oocytes (each point represents the ATP release vs. current amplitude during each minute of recording from minute 7 to minute 20).
